Acacia: Charts
Your Guide to Using Charts in Acacia
Introduction
Acacia supports chart creation and management in two primary ways. Both of these methods give you the ability to display information in a way that matches your theme and provides extremely high visual appeal without requiring you to upload any images. These displays are built on HTML5 and can be changed quickly on the back end of your site.
First, Chart.js support is built in that allows you to create rich and infinitely useful charts within a Text widget, or injected directly in a post to add a powerful visual element to your written information.
The second visual element comes by way of the Progressive Knobs that make it easy to create incredible single-variable visual elements. You could use them to give a status update on an upcoming project, or represent the percentage of a market your business has captured. At the center of these knobs sits an icon powered by of FontAwesome.
NOTE: Neither of these features are currently supported in IE8. We have a fallback built in for Progressive Knobs, but the Chart.js elements will not display correctly. Newer versions of IE, as well as updated Chrome, Firefox, Safari, Opera, and other popular standard-compliant browser options should work just fine.
Chart.js Support
Acacia introduces built-in support for Chart.js. This element allows you to quickly and easily create dynamic graphs that display information in a variety of ways.
You can toggle this feature on and off by navigating to Administrator -> Acacia Theme -> Gizmos -> Chart and toggling the option there. If you have a Custom HTML and/or post with the Chart.js code present, and this option is off, nothing will appear in its place and your browser may indicate a JavaScript error.
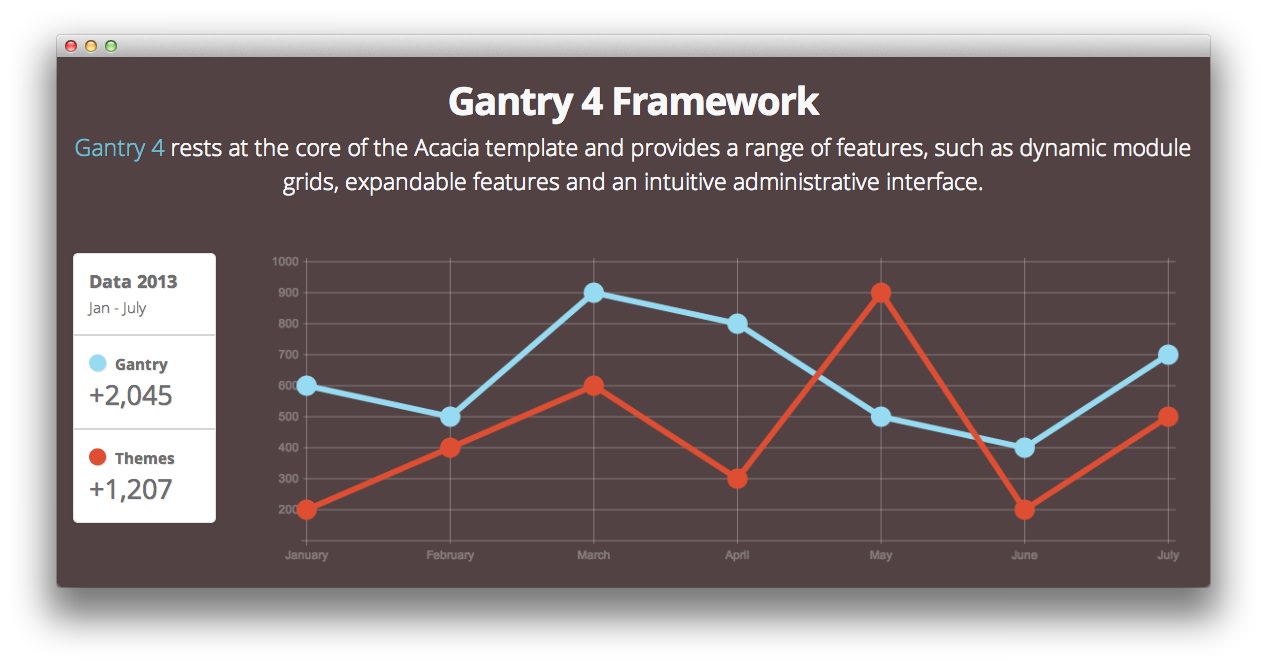
Here is the code block that creates the graph that appears in the above image.
<canvas id="myChart" height="320" width="977"></canvas>
<script type="text/javascript">
    var lineChartData = {
        labels : ["January","February","March","April","May","June","July"],
        datasets : [
            {
                fillColor : "transparent",
                strokeColor : "#97DBF2",
                    pointColor : "#97DBF2",
                    pointStrokeColor : "#97DBF2",
                    data : [600,500,900,800,500,400,700]
                },
                {
                    fillColor : "transparent",
                    strokeColor : "#DE4E33",
                    pointColor : "#DE4E33",
                    pointStrokeColor : "#DE4E33",
                    data : [200,400,600,300,900,200,500]
                }
            ]
        },
        options = {
        //Boolean - If we want to override with a hard coded scale
        scaleOverride : true,

        //** Required if scaleOverride is true **
        //Number - The number of steps in a hard coded scale
        scaleSteps : 9,
        //Number - The value jump in the hard coded scale
        scaleStepWidth : 100,
        //Number - The scale starting value
        scaleStartValue : 100,

        //String - Scale label font colour
        scaleFontColor : "rgba(255,255,255,0.3)",

        //String - Colour of the scale line
        scaleLineColor : "rgba(255,255,255,0.3)",

        //String - Colour of the grid lines
        scaleGridLineColor : "rgba(255,255,255,0.3)",

        //Boolean - Whether the line is curved between points
        bezierCurve : false,

        //Number - Radius of each point dot in pixels
        pointDotRadius : 8,

        //Number - Pixel width of point dot stroke
        pointDotStrokeWidth : 5,

        //Number - Pixel width of dataset stroke
        datasetStrokeWidth : 6,

        //Boolean - Whether to fill the dataset with a colour
        datasetFill : true,

    }

    //Get the context of the canvas element we want to select
    var ctx = document.getElementById("myChart").getContext("2d");
    var myNewChart = new Chart(ctx).Line(lineChartData, options);

</script>
You can find extensive documentation listing the different elements found here on the official website.
Progressive Knobs (Canvas)
Progressive Knobs are custom made for Acacia, allowing you to add a unique design element to your site that displays progression around an icon. This element is similar a loading icon, which adds a familiar aesthetic quality that visitors can quickly relate to.
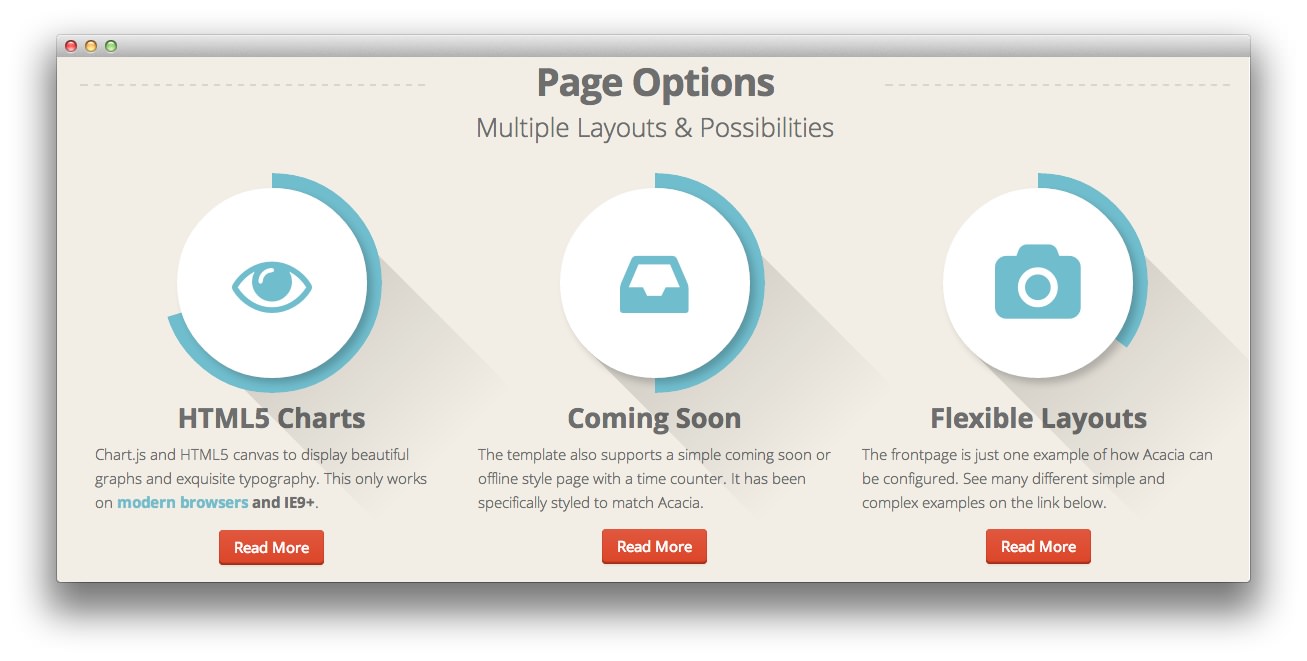
In the image above, three Progressive Knobs are displayed. Each one loads a different icon (sourced from FontAwesome) which can be referenced quickly, and requires no additional uploads to your site.
You can toggle this feature on and off by navigating to Administrator -> Acacia Theme -> Gizmos -> Canvas and toggling the option there.
Virtually everything about a Progressive Knob can be adjusted. From the width of the progression indicator to the size of the icon, all of this information is found and easily adjusted inside a single block of code.
Here is the code related to the Progressive Knob found on the far left in the image above. If you are entering this into a post, you will want to make sure you are either using the Text editor, rather than the Visual editor.
<div class="canvas-graph" data-canvas-graph='{"icon":"icon-eye-open","iconSize":80,"radius":110,"size":15,"start":70}'><div class="longshadow"></div></div>
| Function | Description |
|---|---|
| icon | Shortcode for the icon which appears in the center. You can find a list on our demo. |
| iconSize | The size of your icon (in pixels) at the center of the knob. |
| radius | This sets the radius (multiply by two to get the width) of the circle at the center of the knob. |
| size | This option sets the width (in pixels) of the progression indicator (shown in blue in the above image) |
| start | This sets the starting amount (in percentage) of the progression indicator. In this case, it is set at 70. |
The longshadow div at the end of the line creates that shadow that sweeps across the back of the knob. This div should appear within the primary canvas-graph div that makes up the progressive knob (as seen above).